Kevin leads on the team’s data analysis, providing UK education institutions and other stakeholders with insights and evidence-based recommendations to help them understand overseas markets, recruit overseas students and develop international partnerships. He joined the British Council in 2014 and is based in Beijing but works on projects across the globe.
UK visa issuance and UCAS acceptances suggest a bounce back in non-EU recruitment of international students for the 2021/22 academic year
by Kevin Prest
14/12/2021
Higher Education Institutions

The 2021/22 academic year is now well underway, but full statistics on student numbers at UK universities are still more than a year away. Nevertheless recently-released data from the Home Office and UCAS have given us a look at new international student recruitment and help to show the main trends for the current academic year. Both sources show that despite the ongoing Covid-19 pandemic the UK managed to attract more new non-EU international HE students than ever before, but the picture is much less positive for students from the European Union.
Looking first at visa statistics, figures for the period from July to September were released at the end of November. A total of 244,971 sponsored study visas were issued to main applicants in the third quarter of 2021, bringing the year-to-date total to 308,917.
One major difference compared to last year’s figures is that these numbers now include EU citizens, who didn’t previously need a visa to study in the UK. But even if we only look at non-EU countries the number of visas issued is still substantially higher than the number seen in previous years. The increase in 2021 more than made up for the drop in 2020, and the total number of visas issued in the January to September period was +19% higher than in the equivalent pre-pandemic period. In fact 2021 accounts for more study visa issuances than any previous year even if we compare the Q1-3 figures to full-year data from previous years.
Sponsored student visas issued to main applicants, 2014 to 2021
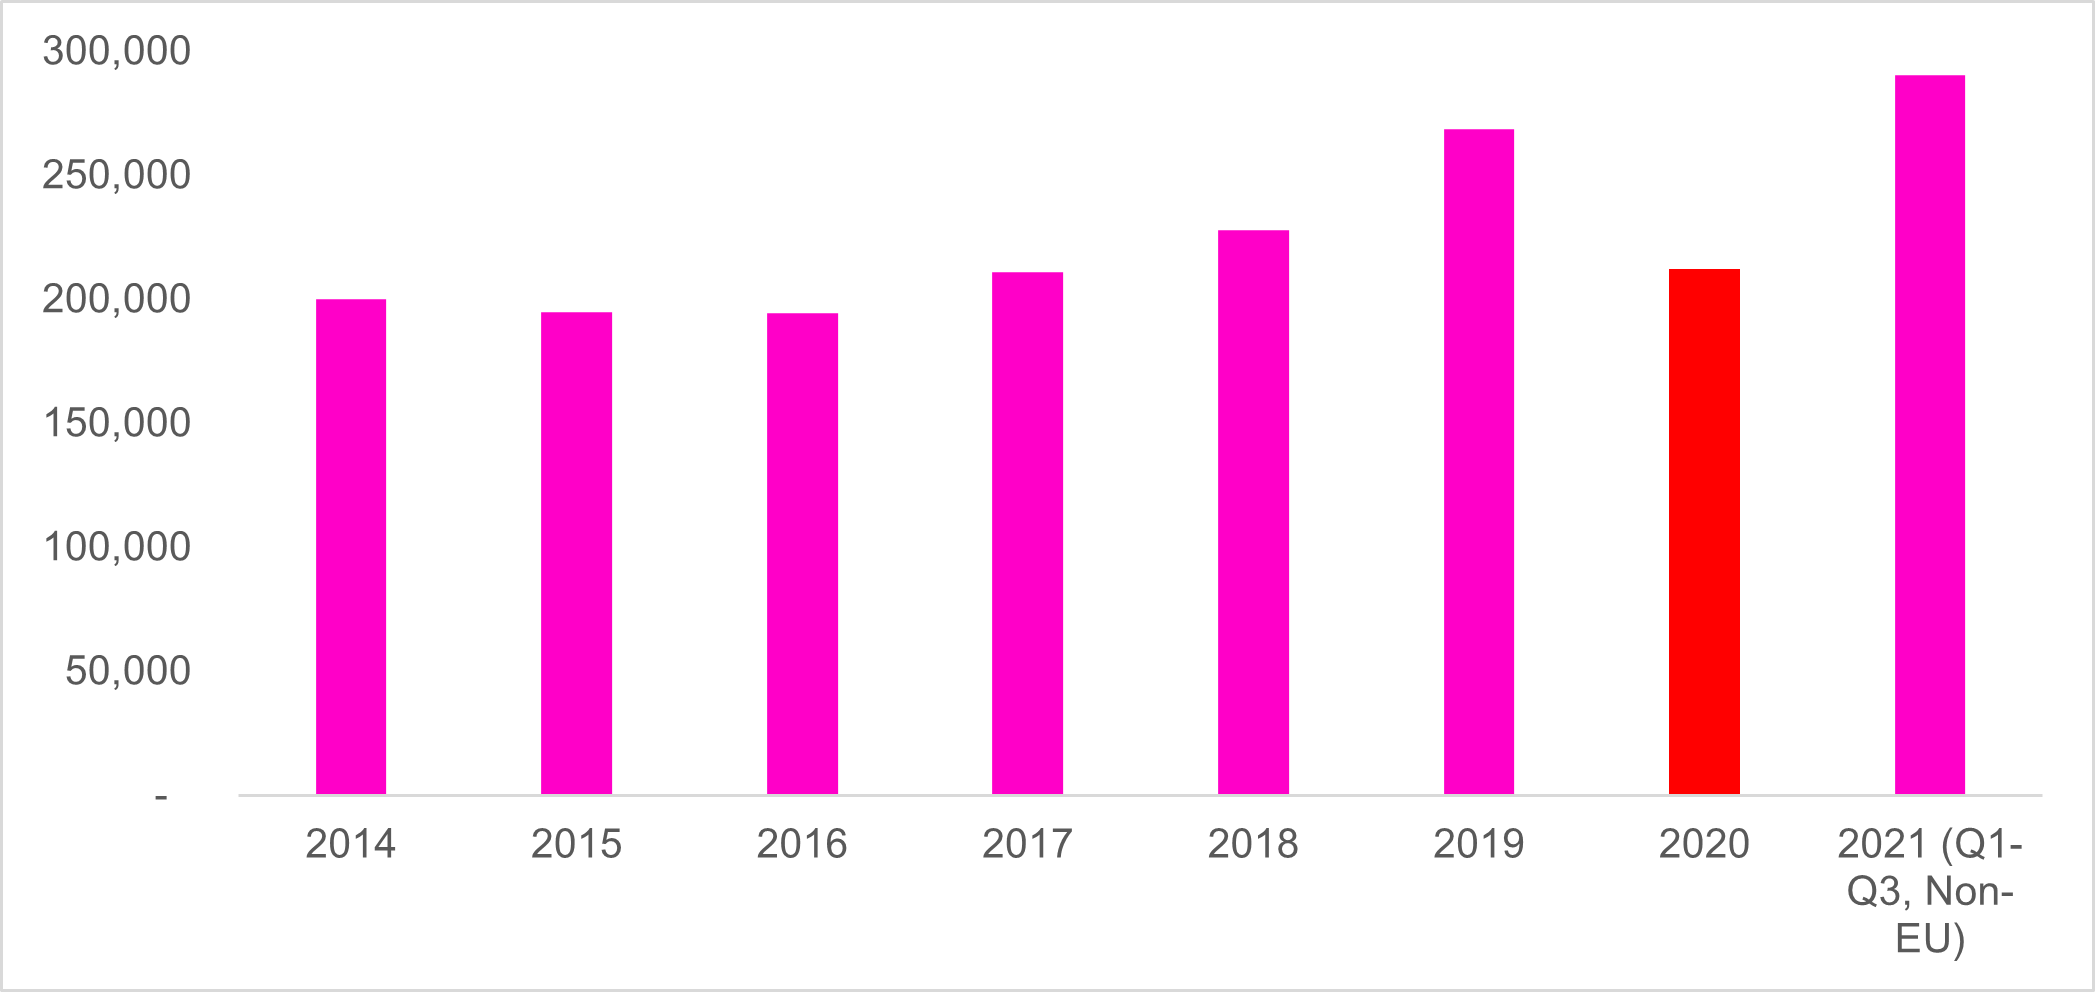
Source: Home Office
Data on UCAS undergraduate acceptances show a similar trend, with a +20% increase in non-EU acceptances for the 2021 entry cycle compared with 2019. But compared with 2020 the growth was much more limited, with acceptances only increasing by 2.4% compared to a 17% growth rate last year. Readers should note that these two pieces of data do not quite cover the same population, because UCAS data only covers undergraduate students and excludes the large number of students transferring to UK institutions under transnational education or articulation / credit-recognition agreements with overseas universities.
Unlike visa statistics, UCAS data also makes it possible to compare data for EU students with previous years. This comparison was much less encouraging, with EU acceptances falling to less than half of their level last year or in 2019 – almost certainly for reasons related to Brexit.
Regional differences in visa issuance trends
Unsurprisingly, all the major sending countries saw a substantial increase in visa issuances compared to 2020. But substantial differences between countries emerge when comparing with data from 2019, a better base year for comparative purposes.
As in the past China is by far the top country in terms of sponsored study visa issuances. But the number of visas issued to Chinese students in the first three quarters of the year declined by 12% compared to the same period in 2019. This shows that the pandemic has seriously affected Chinese study decisions, although readers should note that the figures exclude Chinese students who are enrolled at UK universities but still studying online from their home country.
Other East Asian countries also saw declines compared with the pre-pandemic period. Some of them declined even more than China – for example the number of visas issued to Malaysians fell by 17%, Thailand was down 25%, and Korea was down 14%. Among the top 30 sending countries the only East Asian country that saw growth compare with the first three quarters of 2019 was Indonesia, which was up 3%.
In contrast we continued to see very strong growth from developing countries in South Asia and Sub-Saharan Africa. Visas issued to students from India more than doubled compared to the same period in 2019, while other countries in the region including Pakistan, Bangladesh, Nepal and Sri Lanka had even stronger growth and the number of student visas issued to Nigerians in the first three quarters of 2021 was more than triple the number in the same period of 2019.
Trends in sponsored student visas issued to main applicants from the top 30 sending countries, Jan-Sept 2021 vs same period of 2019
|
|
Visas issued (Jan-Sept) |
Change, 2021 vs 2019 |
||
|
2019 |
2020 |
2021 |
||
|
China |
114,489 |
47,706 |
101,186 |
-11.6% |
|
India |
26,337 |
31,011 |
61,966 |
+135.3% |
|
Nigeria |
5,551 |
4,794 |
18,580 |
+234.7% |
|
United States |
12,719 |
6,694 |
13,197 |
+3.8% |
|
Pakistan |
3,560 |
2,732 |
9,531 |
+167.7% |
|
Hong Kong |
8,652 |
7,341 |
8,497 |
-1.8% |
|
Bangladesh |
1,479 |
1,228 |
6,579 |
+344.8% |
|
Malaysia |
6,828 |
2,974 |
5,651 |
-17.2% |
|
Saudi Arabia |
4,557 |
2,113 |
3,942 |
-13.5% |
|
France |
0 |
0 |
3,861 |
N/A |
|
Canada |
3,389 |
1,846 |
3,584 |
+5.8% |
|
Germany |
0 |
0 |
3,490 |
N/A |
|
Thailand |
4,645 |
1,141 |
3,478 |
-25.1% |
|
Kuwait |
3,340 |
1,879 |
3,321 |
-0.6% |
|
Korea (South) |
3,822 |
1,802 |
3,299 |
-13.7% |
|
Spain |
0 |
0 |
3,170 |
N/A |
|
Taiwan |
3,307 |
1,433 |
2,687 |
-18.7% |
|
Turkey |
2,256 |
1,331 |
2,555 |
+13.3% |
|
Russia |
2,221 |
1,696 |
2,248 |
+1.2% |
|
Indonesia |
2,151 |
834 |
2,206 |
+2.6% |
|
Japan |
2,568 |
1,449 |
2,205 |
-14.1% |
|
Italy |
0 |
0 |
2,108 |
N/A |
|
Nepal |
486 |
606 |
2,050 |
+321.8% |
|
Singapore |
2,313 |
1,262 |
2,032 |
-12.1% |
|
Ghana |
1,260 |
568 |
1,883 |
+49.4% |
|
Sri Lanka |
510 |
456 |
1,793 |
+251.6% |
|
Egypt |
1,614 |
1,178 |
1,545 |
-4.3% |
|
Norway |
0 |
0 |
1,218 |
N/A |
|
Mexico |
1,222 |
391 |
1,122 |
-8.2% |
|
Iran |
610 |
468 |
995 |
+63.1% |
|
Total |
244,957 |
137,319 |
308,917 |
+26.1% |
|
Total (non-EU) |
244,956 |
137,319 |
290,334 |
+18.5% |
Source: Home Office
Trends in UCAS acceptance data are not always identical to the patterns we see in student visa issuances. For example, while visas issued to students from mainland China are down by 11.6% for the first 9 months of 2021 compared with the same period in 2019, there was a 31% increase in UCAS acceptances for the same reference period (mostly due to a strong increase in 2020 followed by growth of only 1% in 2021). Nevertheless the broad pattern is similar, with much stronger increases in South Asia and Sub-Saharan Africa than in the East Asian region; for example, Indian and Nigerian student UCAS acceptances were both 66% higher in 2021 compared to the last pre-pandemic entry cycle.
Looking more closely at students from the European Union we can also see a big split between Eastern and Western Europe. UCAS acceptances from most Western European countries were down by roughly half – for example the number of acceptances from students domiciled in France was down by 50% compared to two years ago, while numbers from Spain were down 45% and those from Germany were 49% lower than in 2019. Meanwhile the major senders in Eastern Europe saw a much bigger drop – the number of students from Poland was down 77%, while Romania-domiciled students were down 80%. Unlike the trends in non-EU countries almost all of the drop in EU students came between 2020 and 2021 showing that Brexit is the main cause of the change. Two major exceptions in the EU region were Ireland and Portugal which both saw continuing increases in student numbers.
Trends in undergraduate acceptances from the top 30 sending countries, 2021 vs 2019
|
|
|
Undergraduate acceptances |
Change, 2021 vs 2019 |
||
|
EU / Non-EU |
2019 |
2020 |
2021 |
||
|
China |
Non-EU |
12,415 |
16,185 |
16,310 |
+31.4% |
|
India |
Non-EU |
2,770 |
4,230 |
4,600 |
+66.1% |
|
Hong Kong |
Non-EU |
3,590 |
4,095 |
4,095 |
+14.1% |
|
Malaysia |
Non-EU |
2,745 |
2,425 |
2,825 |
+2.9% |
|
Portugal |
EU |
1,845 |
1,915 |
2,730 |
+48.0% |
|
USA |
Non-EU |
1,900 |
2,050 |
2,710 |
+42.6% |
|
Ireland |
EU |
1,700 |
2,065 |
2,385 |
+40.3% |
|
France |
EU |
3,000 |
2,930 |
1,515 |
-49.5% |
|
Nigeria |
Non-EU |
905 |
1,125 |
1,500 |
+65.7% |
|
Spain |
EU |
2,720 |
2,985 |
1,495 |
-45.0% |
|
United Arab Emirates |
Non-EU |
1,255 |
1,450 |
1,465 |
+16.7% |
|
Canada |
Non-EU |
1,280 |
1,350 |
1,375 |
+7.4% |
|
Singapore |
Non-EU |
1,530 |
1,490 |
1,300 |
-15.0% |
|
Italy |
EU |
2,485 |
2,270 |
1,135 |
-54.3% |
|
Pakistan |
Non-EU |
815 |
955 |
955 |
+17.2% |
|
Germany |
EU |
1,755 |
1,775 |
895 |
-49.0% |
|
Cyprus (EU) |
EU |
2,070 |
2,050 |
885 |
-57.2% |
|
Korea, Republic of |
Non-EU |
920 |
935 |
790 |
-14.1% |
|
Greece |
EU |
1,745 |
1,710 |
765 |
-56.2% |
|
Switzerland |
Non-EU |
885 |
930 |
745 |
-15.8% |
|
Norway |
Non-EU |
930 |
860 |
705 |
-24.2% |
|
Turkey |
Non-EU |
625 |
645 |
705 |
+12.8% |
|
Saudi Arabia |
Non-EU |
475 |
615 |
605 |
+27.4% |
|
Thailand |
Non-EU |
645 |
615 |
595 |
-7.8% |
|
Russian Federation |
Non-EU |
535 |
565 |
590 |
+10.3% |
|
Poland |
EU |
2,570 |
2,955 |
580 |
-77.4% |
|
Kuwait |
Non-EU |
650 |
725 |
570 |
-12.3% |
|
Romania |
EU |
2,500 |
2,685 |
510 |
-79.6% |
|
Indonesia |
Non-EU |
445 |
415 |
475 |
+6.7% |
|
Bangladesh |
Non-EU |
155 |
210 |
470 |
+203.2% |
|
EU total |
EU |
31,765 |
32,320 |
16,025 |
-49.6% |
|
Non-EU total |
Non-EU |
45,140 |
52,755 |
54,030 |
+19.7% |
Source: UCAS
When discussing these UCAS figures, “acceptance” refers to an applicant accepting an offered place at a UK university. Comparing the trend in acceptances to the trend in applicants shows that acceptance rates declined compared to previous years, with an especially sharp drop for EU students. In 2020 61% of EU-domiciled applicants accepted a place at a UK university; in 2021 the acceptance rate for EU students fell to 51%. The non-EU acceptance rate also dropped, although not as sharply – 49% of applicants accepted a place in 2021 compared to 53% in 2020.
Aside from failing to receive an offer or failing to achieve the grades needed for that offer, reasons why an applicant might not accept a place include a student deciding not to study abroad despite applying, or deciding to go to another country rather than the UK after applying to universities in both countries. Discussions with agents suggest that there has been a trend this year towards students applying for institutions in multiple countries because of uncertainty over the Covid situation in different countries, which could be a major reason behind the falling acceptance rate.
Differences in student types
As mentioned above, there are notable differences between trends in visa numbers and those in undergraduate acceptances through UCAS. In general East Asian countries saw slower decline or even continued growth in UCAS acceptances compared to a drop in visa issuances, while the developing countries that saw more positive trends between 2019 and 2021 had less dramatic growth in undergraduate acceptances than in visas. While one explanation for this trend is that some students in East Asia are starting their studies online rather than coming to the UK, the figures likely also point to a real difference between students studying a full UK undergraduate course and those who will study a postgraduate programme or who would otherwise articulate to the UK after starting their studies in a local university - possible reasons for this are discussed in the following section.
Visa data also shows a strong divergence between general student visas and child student visas. Overall the number of Child Student visas issued in the first three quarters of 2021 (excluding visas issued to EU citizens) was down 18% compared to the same period of 2019, compared to +20% growth in the General category.
The story behind the numbers
The two main factors affecting recent trends in UK study for non-EU students are the Covid-19 pandemic and the recent introduction of post-study work visas under the Graduate Route. These factors go a long way to explaining the difference in East Asian countries vs South Asia and Sub-Saharan Africa.
The British Council’s previous research shows that students in East Asia are relatively more concerned about Covid-19 than those in other parts of the world, perhaps due to that region being less affected than many other parts of the world which makes the UK look less attractive in comparison.
Meanwhile students from developing countries generally tend to place more weight on post-study work and immigration compared to those from comparatively wealthier parts of the world. This helps to explain why countries like India and Nigeria saw a particularly strong increase after recent changes to the UK’s post-study work visa environment with the introduction of the Graduate Route.
The impact of Covid also goes some way towards explaining the difference in trends between UCAS undergraduate acceptances and visa issuances. As most postgraduate students only plan to study in the UK for one year, Covid-related course disruptions will affect a larger proportion of their course compared to students studying a full 3+ year undergraduate programme; this would make Covid a more prominent factor in the decision for these students and drive them towards staying in their home country rather than coming to the UK. Potential postgraduates are also more likely to be able to decide not to go on to further study, while most students in a position to come to the UK would already have a strong expectation that they would complete a bachelor's degree.
Similarly, the difference in trends for child students compared to general students is probably also pandemic-related. The British Council’s student research consistently finds that safety is one of the top issues for parents of school-age children whereas it is a comparably less important factor (although definitely still important overall) for prospective university students.
In the EU the sharp difference between trends in 2020 compared to 2021 shows that Brexit is by far the most important reason for the decline in student numbers. As well as needing to apply for visas to study in the UK, students from EU countries are now no longer eligible for home-rate tuition fees. Perhaps an even more important change is their loss of access to UK student finance options that previously meant they could pay back their tuition fees once they started to earn a high income rather than having to pay for their course up-front or take out a more expensive commercial loan. Continued growth in Ireland is the exception that proves the rule, as Irish students can still take advantage of home fees and UK government loans under the Common Travel Area agreement.
Sources
Visa data: https://www.gov.uk/government/statistics/announcements/immigration-statistics-year-ending-september-2021 .
UCAS acceptance data: https://www.ucas.com/data-and-analysis/undergraduate-statistics-and-reports/ucas-undergraduate-sector-level-end-cycle-data-resources-2021
Theme:
About the Author

Kevin Prest
Education Insights Global Team - Senior Analyst


Add new comment
Please note that comments by non-members are moderated. They do not appear on the site until they have been approved. Comments by registered members appear here immediately. Your email address will not be published. All fields are required.